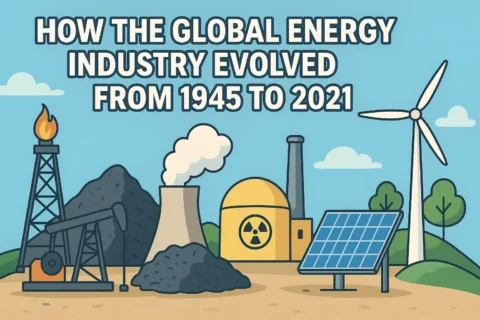
The global energy industry evolution from 1945 to 2021 represents one of the most dramatic transformations in modern economic history. What began as an oil-dominated system controlled by a handful of Western corporations became a complex, interconnected web of fossil fuels, nuclear power, and renewable energy—shaped by geopolitical upheavals, technological breakthroughs, and the growing urgency of climate change.
This 76-year journey fundamentally reshaped how the world powers itself, trades energy, and thinks about sustainability. From the post-war oil boom to the renewable energy revolution, each decade brought seismic shifts that continue to influence energy markets today.
The Foundation Years: Post-War Reconstruction and Oil Supremacy (1945-1960s)
Building the Petro-Economy
The story begins in the rubble of World War II, when American economic architects designed a new global order. The Marshall Plan (1948-1952) and Bretton Woods institutions didn’t just rebuild Europe—they embedded a dollar-denominated oil trade that would define energy commerce for decades.
At the center of this system sat the “Seven Sisters”—a cartel of Western oil giants including Exxon, Mobil, Chevron, Gulf, Texaco, BP, and Shell. By 1960, these companies controlled over 80% of global oil reserves, operating under long-term concessions with fixed posted prices. They essentially decided who got oil, when, and at what price.
The infrastructure boom was staggering. Supertankers began crossing oceans loaded with crude, while pioneering pipelines like the Trans-Arabian Pipeline (1950) and later the Druzhba pipeline (1964) moved oil across continents. The petrochemical age had begun, transforming everything from plastics to pharmaceuticals.
This wasn’t just about energy—it was about reshaping the global economy around oil.
Key Timeline: Early Energy Era (1945-1960s)
| Year | Milestone Event | Impact |
|---|---|---|
| 1948 | Marshall Plan launched | Embedded dollar-denominated oil trade |
| 1950 | Trans-Arabian Pipeline completed | Enabled long-distance oil transport |
| 1954 | First nuclear power plant operational | Nuclear age begins |
| 1956 | Suez Crisis | Highlighted oil supply vulnerabilities |
| 1960 | OPEC formation | Producer countries unite against Western oil majors |
| 1964 | First major LNG export (Algeria-UK) | Birth of global gas trade |
The Seismic Shifts: OPEC’s Rise and the Great Oil Shocks (1960s-1980s)
When Producers Fought Back
The comfortable Western dominance wouldn’t last. In 1960, five oil-producing nations—Iraq, Iran, Kuwait, Saudi Arabia, and Venezuela—formed OPEC, determined to wrest control from the Seven Sisters.
The real earthquake came on October 6, 1973. Following the Yom Kippur War, Arab oil producers imposed an embargo on countries supporting Israel. Oil prices didn’t just rise—they quadrupled virtually overnight.
The 1973 oil shock changed everything. For the first time since World War II, energy became a weapon of geopolitical warfare. Long lines formed at gas stations across America. European governments imposed driving bans. The global economy plunged into recession.
But crisis sparked innovation. The United States created the International Energy Agency (IEA) for emergency oil stockpiling and passed CAFE standards to improve vehicle efficiency. Countries scrambled to diversify their energy sources, accelerating nuclear power programs and seeking alternative oil supplies.
The Second Shock and New Realities
Just as markets were adjusting, the 1979 Iranian Revolution delivered another devastating blow. The overthrow of the Shah, followed by the Iran-Iraq War, removed millions of barrels from global markets. Oil prices soared above $40 per barrel—equivalent to roughly $130 in 2021 dollars.
This second shock proved that the global energy industry evolution wasn’t a smooth progression—it was a series of violent disruptions that forced rapid adaptation.
The response was swift and global. North Sea oil platforms began pumping in the harsh Atlantic waters. Alaska’s Prudhoe Bay came online via the Trans-Alaska Pipeline. Mexico’s massive Cantarell field started production. These non-OPEC sources began breaking the cartel’s stranglehold on global supply.
Oil Price Shock Impact: The Numbers Don’t Lie
| Crisis Event | Year | Oil Price Before | Oil Price After | Economic Impact |
|---|---|---|---|---|
| Arab Oil Embargo | 1973 | $3/barrel | $12/barrel (300% increase) | Global recession, 6.1% GDP contraction |
| Iranian Revolution | 1979 | $15/barrel | $40/barrel (167% increase) | Second energy crisis, inflation spike |
| Market Recovery | 1986 | $40/barrel | $10/barrel (75% decline) | Oil glut, producer country stress |
Prices adjusted to nominal dollars of respective periods. Sources: US EIA, Macrotrends
Beyond Oil: The Rise of Gas, Coal, and Nuclear Power
The Natural Gas Revolution
While oil grabbed headlines, natural gas was quietly building a global network. Europe and the Soviet Union constructed dense pipeline systems—the Trans-Siberian, Yamal, and Brotherhood pipelines became energy arteries connecting nations.
The real breakthrough was liquefied natural gas (LNG). The first major LNG export shipped from Algeria to the UK in 1964, followed by Japan’s imports in 1969. By the 2000s, Qatar, Australia, Malaysia, and Indonesia had built massive liquefaction facilities, creating a truly global gas trade. This decade had very significant chapter for the global energy industry evolution.
Nuclear’s Rise and Stall
Nuclear power experienced its own dramatic arc. The 1950s through 1980s saw explosive growth as the United States, France, USSR, Japan, and UK pioneered commercial nuclear reactors. France went furthest, eventually generating over 70% of its electricity from nuclear plants.
Then came the accidents that changed everything. Three Mile Island (1979), Chernobyl (1986), and later Fukushima (2011) triggered public backlash, stricter regulations, and slower nuclear growth outside Asia. The promise of “atoms for peace” collided with the reality of catastrophic risk.
Global Nuclear Capacity Growth (1960-2021)
| Decade | Global Nuclear Capacity (GW) | Key Developments |
|---|---|---|
| 1960 | 1 | First commercial reactors |
| 1970 | 16 | Rapid expansion begins |
| 1980 | 135 | Peak construction era |
| 1990 | 318 | Three Mile Island impact |
| 2000 | 348 | Post-Chernobyl slowdown |
| 2010 | 375 | Renaissance interrupted |
| 2021 | 393 | Asian growth, Western stagnation |
Source: IAEA, World Nuclear Association
The Great Opening: Market Liberalization and Asian Demand (1990s-2000s)
From Monopoly to Marketplace
The 1990s brought a revolutionary shift from state-controlled energy monopolies to competitive markets. The UK led the charge in 1990, followed by U.S. power market reforms in 1992. The European Union fully unbundled its utilities, creating space for private power producers and merchant generators.
This liberalization coincided with an explosion in financial markets. Oil and gas futures trading soared on exchanges like NYMEX and ICE. Energy became not just a commodity but a financial instrument, traded by algorithms and hedge funds. Price volatility increased, but so did market efficiency and price discovery.
The Asian Century Begins
Nothing changed the global energy landscape like China’s economic awakening. China’s WTO entry in 2001 marked the beginning of an unprecedented demand surge. As factories sprouted across Chinese cities and millions migrated from rural areas, energy consumption exploded.
China became the world’s largest coal consumer, a major oil importer, and increasingly, a significant gas buyer. Shipping chokepoints like the Strait of Hormuz and Malacca Strait gained renewed strategic importance as Asian energy trade flourished.
This was the beginning of the “commodity supercycle”—a period of soaring prices driven primarily by Asian industrialization.
Global Primary Energy Mix Evolution (1950-2021)
| Energy Source | 1950 | 1970 | 1990 | 2010 | 2021 |
|---|---|---|---|---|---|
| Oil | 10% | 44% | 39% | 34% | 31% |
| Coal | 60% | 34% | 30% | 29% | 27% |
| Natural Gas | 5% | 16% | 20% | 23% | 25% |
| Hydro | 22% | 6% | 7% | 7% | 7% |
| Nuclear | 0% | 0% | 4% | 5% | 4% |
| Other Renewables | 3% | 0% | 0% | 2% | 6% |
Percentages rounded. Sources: BP Statistical Review, Our World in Data, Energy Institute
Technological Revolution: Shale, Renewables, and the New Energy Paradigm (2000s-2010s)
The American Shale Miracle
Perhaps no single development transformed global energy markets more than America’s shale revolution. Combining horizontal drilling with hydraulic fracturing, U.S. producers unlocked vast reserves of oil and gas trapped in tight rock formations.
The results were staggering. By 2019, the United States had become the world’s largest oil and gas producer—a transformation that seemed impossible just two decades earlier. American LNG began flowing to global markets, fundamentally altering trade patterns and geopolitical relationships.
OPEC’s response was the formation of “OPEC+”—expanding the cartel to include Russia and other non-OPEC producers in an attempt to maintain market influence.
The Renewable Energy Cost Revolution
While shale grabbed headlines, an even more profound transformation was occurring in renewable energy. Solar photovoltaic costs plummeted by roughly 85% between 2009 and 2021. Wind power costs fell similarly. Battery storage costs dropped over 80%.
These weren’t marginal improvements—they represented a fundamental shift in energy economics. By 2021, solar and wind had become the cheapest sources of electricity in most markets, even without subsidies.
Grid operators learned to manage intermittency through battery storage, demand response, and sophisticated forecasting. What had once been niche technologies became mainstream power sources.
The Renewable Energy Cost Revolution (2009-2021)
| Technology | 2009 Cost ($/MWh) | 2021 Cost ($/MWh) | Cost Reduction |
|---|---|---|---|
| Utility Solar PV | $200-400 | $25-60 | 85% decline |
| Onshore Wind | $100-160 | $28-60 | 65% decline |
| Offshore Wind | $150-250 | $50-90 | 60% decline |
| Coal (reference) | $80-140 | $55-115 | 30% decline |
| Gas CCGT (reference) | $60-120 | $35-85 | 40% decline |
| Lithium-ion Batteries | $1,100/kWh | $140/kWh | 87% decline |
LCOE ranges vary by geography and project specifics. Sources: IRENA, Lazard, BloombergNEF
Climate Policy Enters the Energy Equation (1990s-2021)
From Rio to Paris
Environmental concerns gradually evolved from niche worry to central policy driver. The 1992 Rio Summit established the UN Framework Convention on Climate Change. The 1997 Kyoto Protocol created binding emission targets for developed countries, launching carbon markets and clean development mechanisms.
The 2015 Paris Agreement represented a watershed moment, with 196 countries pledging to limit global warming to 1.5-2°C above pre-industrial levels. While not legally binding on specific targets, Paris fundamentally shifted investment flows and corporate strategies.
Corporate Energy Transformation
Major oil companies began reshaping their portfolios. Equinor, BP, and Shell invested heavily in renewables and low-carbon technologies. Financial markets embraced ESG (Environmental, Social, and Governance) criteria, while divestment campaigns targeted fossil fuel investments.
The global energy industry evolution wasn’t just driven by technology and geopolitics anymore—climate policy had become a primary force shaping investment decisions and corporate strategies.
Major Climate Policy Milestones (1992-2021)
| Year | Agreement/Policy | Key Provisions | Global Impact |
|---|---|---|---|
| 1992 | Rio Earth Summit (UNFCCC) | Framework for climate action | Established international climate cooperation |
| 1997 | Kyoto Protocol | Binding emissions targets for developed countries | Created carbon markets, CDM mechanisms |
| 2005 | Kyoto enters force | EU ETS launches | First major carbon trading system |
| 2015 | Paris Agreement | 1.5-2°C warming limit goal | 196 countries committed to climate action |
| 2021 | Glasgow Climate Pact | Phasing down coal, methane reductions | Accelerated net-zero commitments |
Sources: UNFCCC, EU Parliament, Climate Action Tracker
Energy Security Revisited: Infrastructure and Trade Routes
Throughout this period, energy infrastructure became increasingly critical to national security. Major pipelines like Nord Stream, Baku-Tbilisi-Ceyhan, and the proposed TAPI pipeline weren’t just commercial projects—they were geopolitical instruments.
LNG terminals proliferated, allowing countries to diversify supply sources and reduce dependence on pipeline imports. Australia, Qatar, and the United States emerged as major LNG exporters, shipping to markets across Europe and Asia.
Conflicts and sanctions repeatedly disrupted energy flows—from the Iran-Iraq War to the Gulf War, Iraq invasion, Libyan civil war, and Crimea annexation. Each crisis forced market adaptations and strategic stockpiling adjustments.
The Numbers Tell the Story
The quantitative transformation was remarkable. Global primary energy consumption nearly tripled from 1950 to 2021. Oil’s share of the energy mix peaked around 1970 at 44%, then gradually declined as natural gas (reaching ~24% by 2021) and renewables gained ground.
Nuclear power grew from zero in 1950 to about 4% of primary energy by 2021, while renewables beyond hydro expanded to roughly 7%. Coal, despite environmental concerns, remained significant at about 30% globally, primarily due to Asian demand.
The cost transformations were even more dramatic. Utility-scale solar costs fell from $200-400 per MWh in 2009 to just $25-60 by 2021. Onshore wind dropped from $100-160 to $28-60 per MWh over the same period.
LNG Trade Growth: From Niche to Global Commodity (1970-2021)
| Decade | Global LNG Trade (bcm/year) | Major Exporters | Key Importers |
|---|---|---|---|
| 1970 | 5 | Algeria, Libya | Japan, Europe |
| 1980 | 30 | Algeria, Indonesia, Malaysia | Japan, South Korea |
| 1990 | 80 | Algeria, Indonesia, Qatar | Japan, South Korea, Taiwan |
| 2000 | 150 | Qatar, Indonesia, Algeria | Japan, South Korea, Europe |
| 2010 | 240 | Qatar, Malaysia, Indonesia | Japan, South Korea, China |
| 2021 | 380 | Qatar, Australia, USA | Japan, China, South Korea, Europe |
bcm = billion cubic meters. Sources: GECF, BP Statistical Review, IEA
Key Takeaways: Lessons from 76 Years of Energy Evolution
The global energy industry evolution from 1945 to 2021 offers several critical insights:
• Geopolitical events repeatedly reshape energy markets—from OPEC’s formation to oil embargoes, wars, and sanctions, political decisions drive market fundamentals
• Technology disruptions create new possibilities—the shale revolution, LNG expansion, and renewable cost declines weren’t gradual changes but sudden shifts that altered global dynamics
• Market structures evolve from monopolistic control to complex, financialized systems—energy became a tradable commodity with sophisticated pricing mechanisms and financial instruments
• Climate policy emerged as a primary driver—what began as environmental concern became a central force shaping investment, regulation, and corporate strategy
• Asian demand growth fundamentally altered global trade patterns—China’s rise shifted the center of energy gravity from Atlantic to Pacific markets
• Energy security remains paramount—despite globalization and market integration, countries prioritize supply security and infrastructure diversification
• Infrastructure investments have multi-decade impacts—pipelines, LNG terminals, and power plants built today will shape energy systems for generations
Looking Forward: Setting the Stage
By the end of 2021, the global energy system sat at a critical inflection point. The intersection of energy security, affordability, and decarbonization created unprecedented challenges. Renewable energy had achieved cost competitiveness, but intermittency and grid integration remained complex problems. Climate policies were accelerating, but implementation gaps persisted.
The system that had evolved over 76 years—from post-war reconstruction through oil shocks, market liberalization, Asian growth, technological revolution, and climate policy integration—was about to face its next great test.
That test came in February 2022, when Russia’s invasion of Ukraine triggered the most severe energy crisis since the 1970s oil shocks. But that’s a story for Part 2 of our series, where we’ll explore how the global energy industry evolution continues to unfold in real time.
The foundation laid between 1945 and 2021 would determine how well the world could navigate this latest energy transformation. The lessons learned from decades of disruption, adaptation, and innovation had prepared the global energy industry for its next chapter—one that would be written in the crucible of war, geopolitical realignment, and accelerated energy transition.
Frequently Asked Questions (FAQs)
What caused the most significant changes in the global energy industry evolution between 1945-2021?
The most transformative events were: 1) The 1973 and 1979 oil shocks that broke Western oil company dominance, 2) The U.S. shale revolution (2000s-2010s) that reshuffled global supply, 3) China’s economic rise creating massive new demand, and 4) The renewable energy cost revolution making solar and wind competitive with fossil fuels.
How did OPEC change the global energy landscape?
OPEC, formed in 1960, shifted power from Western oil companies (“Seven Sisters”) to producer countries. The 1973 oil embargo demonstrated that energy could be weaponized, quadrupling oil prices and forcing consumer nations to diversify supply sources, improve efficiency, and create strategic reserves.
When did renewable energy become economically competitive?
The breakthrough occurred primarily between 2009-2015. Solar PV costs fell 85% and onshore wind costs dropped 65% during this period. By 2015-2020, renewables became the cheapest electricity source in most markets, even without subsidies.
What role did natural gas play in the energy transition?
Natural gas served as a “bridge fuel” in the transition from coal to renewables. LNG technology (first major export in 1964) created global gas markets, while combined-cycle gas turbines achieved >60% efficiency. Gas helped reduce emissions while providing backup power for intermittent renewables.
How did nuclear power’s role evolve over this period?
Nuclear power expanded rapidly from the 1950s-1980s, reaching 393 GW global capacity by 2021. However, major accidents (Three Mile Island 1979, Chernobyl 1986, Fukushima 2011) slowed growth in Western countries, while Asia continued expansion, particularly China.
What was the impact of energy market deregulation?
Starting with the UK in 1990 and U.S. in 1992, deregulation broke up state/utility monopolies, introduced competition, and enabled financial trading. This created more efficient pricing but also increased volatility and complexity in energy markets.
Think About This: Questions for Energy Leaders
As we stand at the threshold of another major energy transformation, consider these strategic questions that will shape the next chapter of the global energy industry evolution:
🧠 Strategic Question #1: The Resilience vs. Efficiency Trade-off
Given the lessons from 76 years of energy disruptions—from oil embargoes to nuclear accidents to supply chain vulnerabilities—should energy systems prioritize resilience and redundancy over economic efficiency? How would this change your organization’s investment strategy and risk management approach?
🧠 Strategic Question #2: The Speed vs. Scale Dilemma
The renewable cost revolution happened faster than most experts predicted, while the nuclear build-out took decades and faced significant setbacks. As we face the urgency of climate action, which energy technologies should receive priority investment: those that can scale quickly (like solar/wind but with intermittency challenges) or those that provide baseload power (like nuclear/geothermal but with longer development timelines)? What does the historical pattern of energy transitions teach us about managing this trade-off?
Social Media Excerpt: From oil’s post-war dominance to the renewable revolution—discover how 76 years of disruption, innovation, and geopolitical upheaval shaped today’s global energy landscape. The complete history from 1945-2021.
![Economic Batton Race [AI Symbolic]](https://gurusadda.com/wp-content/uploads/2025/08/Economic-Batton-Race-AI-Symbolic-3-2-300x200.webp)